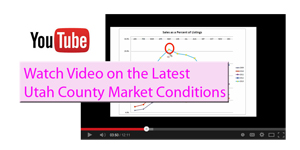
This "Utah County Sold Homes" graph is compiled from the Utah County
Association of Realtors. This graph shows the homes sold
in Utah County over the past few years. Each dot represents
the number of homes sold in any particular month
ranging from 2009-2013. This graph does not include for
sale by owner homes, some builder homes or custom homes
that were not listed for sale on the MLS. I think this
graph represents about 90% of the Utah County sold homes
inventory. Below the graph I will comment on each year
and where our market is currently heading. The yearly legend is located on the
right side of the graph below. If you follow the youtube
link a video will appear with my latest quarterly
evaluation of the current market conditions.
Yearly Review of the Utah County Sold
Homes Inventory
2013
- This was the big wave us Realtors were waiting
for. In July of 2013 we had 700 homes sell.
WOW! We see
a sharp decline in the 3rd and fourth quarters
of 2013. I don't think we will see this number
of sales in 2014.
2012 - I was closing some buyer's that were getting a 3.5% interest rate on a 30 year note. It was hard to believe. In fact, from 2007 - 2011 Approximately 25% of the homes were Bank Foreclosures and another 25% of the homes were short sales. Thus, 50% of the Utah County Real Estate Market were distressed properties. In the fourth quarter of 2012 this changed. About 3% of the Utah County Real Estate Inventory were Bank Foreclosures in the 4th quarter of 2012.
If a buyer found a bank foreclosure it seemed to have several offers on it within a few days. Everything was changing so quickly. Buyer's previously had all the time in the world to consider buying a Utah County bank foreclosure. If you found a bank foreclosure you would have to make an offer very quickly to avoid competing for the home.
2011 - This is the year things started to really change. The Utah County Real Estate
sold homes Inventory dropped from 3,880 homes for sale down to 3,050 homes for sale. Bargain shoppers came pouring into the Utah County real estate market. Many buyers were buying short sales and bank foreclosures during this time period. This was the first year in several years where the Utah County Real Estate Market began to feel somewhat normal and balanced again.
2010 - Interest rates continued to drop in 2010 bringing many buyers into the market. The governement began offering tax incentives for buyer's to buy homes. This was not a good idea. Most Utah County Realtors were upset by the governemnts intervention. As you can see this caused a surge in the Spring of 2010 and a flop in the summer. Many Realtors experienced their slowest selling
(sold homes) summer ever. The governement tax incentive rushed many buyers into the market early and left big gaps down the road.
2009 - Buyer's were
nervous during 2009 and felt confident the bottom was not in at this time.
However, in the summer was saw a significant surge. In July 2009 the
Realtors in Utah County managed to sell around 575 homes. More than 50% of
those sold homes were bank foreclosures and short sales.


